---
title: "Project: Mining customer reviews at scale"
subtitle: "From tens of thousands of reviews to an evidence-backed opportunity brief"
jupyter: gaba-core
---
This project asks you to do what a real product analytics team does with a mountain of customer feedback: read all of it, without reading any of it yourself. You will run a structured-extraction pipeline over tens of thousands of product reviews, turn the extractions into named themes, track those themes over time, and condense the result into a one-page opportunity brief that a product manager could act on. Every skill comes from earlier chapters; what is new is the scale, and the discipline that scale demands. We supply the milestones, the evaluation gates, and the traps; you supply the work and the judgment.
::: {.callout-note title="Setup for this chapter"}
The project itself is yours to run at scale, in your own scripts with checkpoints; the milestone code blocks below are sketches to adapt. But the chapter opens with a working miniature, the entire pipeline executed on one hundred fifty real reviews, so you can see every artifact the milestones ask for before you build the big version. Running it needs an `OPENROUTER_API_KEY` and the `huggingface_hub` library (the reviews stream from the Hugging Face Hub); the full project additionally needs patience and the gates. Budget a few hours of wall-clock time across the milestones, most of it waiting on API calls you have already verified on small samples.
:::
## The brief
A product team in a category you choose, say video games, kitchen appliances, or pet supplies, wants to know what to build or fix next. They have one asset that nobody has fully exploited: years of customer reviews, tens of thousands of them. Buried in that text are recurring complaints, delights, and gaps that competitors have not filled. Nobody can read 50,000 reviews. Skimming a sample misses the slow-burning issues, and keyword counts cannot tell "the battery died" from "the battery lasts forever, I was worried it would die."
Your deliverable is a one-page market-opportunity brief: the top pain themes in the category, with their size, their trajectory over time, representative customer quotes, and one concrete recommendation.
One constraint separates this from storytelling and makes it analytics: every claim in the brief must trace back to counted extractions and quoted reviews. If the brief says "complaints about controller drift doubled between 2021 and 2023," there must be a query against your extraction table that reproduces those numbers.
The project is split into four milestones, each producing an artifact that is consumed by the next, with an evaluation gate before the artifact is allowed to move downstream.
## The pipeline in miniature, end to end
Before the milestones, we run the whole pipeline at 1/300th scale: one hundred fifty video-game reviews, extracted, themed, and trended for real. Everything below this section scales these exact moves up; nothing else changes but the counts and the discipline.
```{python}
from dotenv import load_dotenv
load_dotenv()

import json
import pandas as pd
from huggingface_hub import HfFileSystem

# Stream the raw review file straight off the Hub and stop after 150 keepers:
# a few hundred kilobytes transferred, out of a category file measured in
# gigabytes. Never download what you only need the front of.
fs = HfFileSystem()
PATH = ("datasets/McAuley-Lab/Amazon-Reviews-2023"
        "/raw/review_categories/Video_Games.jsonl")

rows = []
with fs.open(PATH, "r") as f:
    for line in f:
        r = json.loads(line)
        text = (r.get("text") or "").strip()
        if 60 <= len(text) <= 600 and r["rating"] <= 3:   # complaints carry the signal
            rows.append({"text": text, "rating": r["rating"],
                         "year": pd.Timestamp(r["timestamp"], unit="ms").year})
        if len(rows) == 150:
            break

reviews = pd.DataFrame(rows)
print(f"{len(reviews)} low-rating reviews, {reviews.year.min()}-{reviews.year.max()}")
```
Milestone 1's move is structured extraction with the Chapter 11 concurrency pattern:
```{python}
from concurrent.futures import ThreadPoolExecutor
from pydantic import BaseModel, Field
from gaba.llm import call_structured

class Extraction(BaseModel):
    issues: list[str] = Field(description="each distinct problem, as a short noun phrase like 'controller drift' or 'pay-to-win economy'; empty if none")

def extract(text: str) -> list[str]:
    return call_structured(
        "Extract the problems this reviewer experienced:\n" + text, Extraction,
        system="You extract product issues from reviews. Issues only, no praise.",
    ).data.issues

with ThreadPoolExecutor(max_workers=8) as pool:
    review_issues = list(pool.map(extract, reviews.text))

issues = pd.DataFrame([
    {"issue": i, "year": y, "rating": rt}
    for ints, y, rt in zip(review_issues, reviews.year, reviews.rating)
    for i in ints
])
print(f"{len(issues)} issue mentions from {len(reviews)} reviews")
issues.head(6)
```
Before these extractions are fed to anything downstream, we apply Gate A's move at miniature scale. We read the first ten reviews ourselves and wrote down each one's issues by hand, before looking at any model output; those labels are committed with the book. Scoring is fuzzy by token overlap, with the threshold fixed before we looked at a single score:
```{python}
from gaba import DATA_DIR

gold = json.loads((DATA_DIR / "reviews_gold_10.json").read_text())["labels"]

def fuzzy(a: str, b: str, threshold: float = 0.5) -> bool:
    """Token-Jaccard match: same complaint, different words."""
    wa, wb = set(a.lower().split()), set(b.lower().split())
    return len(wa & wb) / max(len(wa | wb), 1) >= threshold

tp = fp = fn = 0
for g in gold:
    assert reviews.text.iloc[g["index"]].startswith(g["text_start"])  # same stream order
    pred = review_issues[g["index"]]
    hits = sum(any(fuzzy(p, lab) for lab in g["issues"]) for p in pred)
    tp += hits
    fp += len(pred) - hits
    fn += sum(not any(fuzzy(lab, p) for p in pred) for lab in g["issues"])

print(f"gate A at n=10: precision {tp / max(tp + fp, 1):.2f}, "
      f"recall {tp / max(tp + fn, 1):.2f}  (fuzzy Jaccard >= 0.5)")
```
Two cautions apply to reading these numbers. Token overlap is a crude stand-in for "matches by meaning", so treat the printed precision and recall as a floor and read the actual mismatches before believing either; some will be the same complaint in different words, and some will be real disagreements worth a prompt fix. And ten reviews serve only as a smoke test: they catch an extractor that is badly broken before any money is spent scaling it, while the real Gate A below demands fifty labels and match-by-meaning judgment. One of our ten, a two-star review whose text is pure praise, exists to check the empty case: an extractor that invents an issue there fails in the way that matters most at scale.
Milestone 2's move is themes from embeddings (Chapters 6 and 13), with one naming call per cluster:
```{python}
from sklearn.cluster import KMeans
from gaba.embed import embed_texts
from gaba.llm import call_llm

vecs = embed_texts(issues.issue.tolist())
issues["theme_id"] = KMeans(n_clusters=6, random_state=0, n_init=10).fit_predict(vecs)

def name_theme(examples: list[str]) -> str:
    reply = call_llm(
        "Name the single product-issue theme these all belong to:\n- "
        + "\n- ".join(examples[:12]),
        system="Reply with the theme name only: two to five words, no preamble, "
               "no punctuation, no formatting.").text
    # Lightweight models sometimes add a preamble anyway; keep the last line.
    return reply.strip().splitlines()[-1].strip(" *\"'.")

themes = (issues.groupby("theme_id").agg(mentions=("issue", "size"))
          .sort_values("mentions", ascending=False).reset_index())
themes["theme"] = [name_theme(issues[issues.theme_id == t].issue.tolist())
                   for t in themes.theme_id]
themes[["theme", "mentions"]]
```
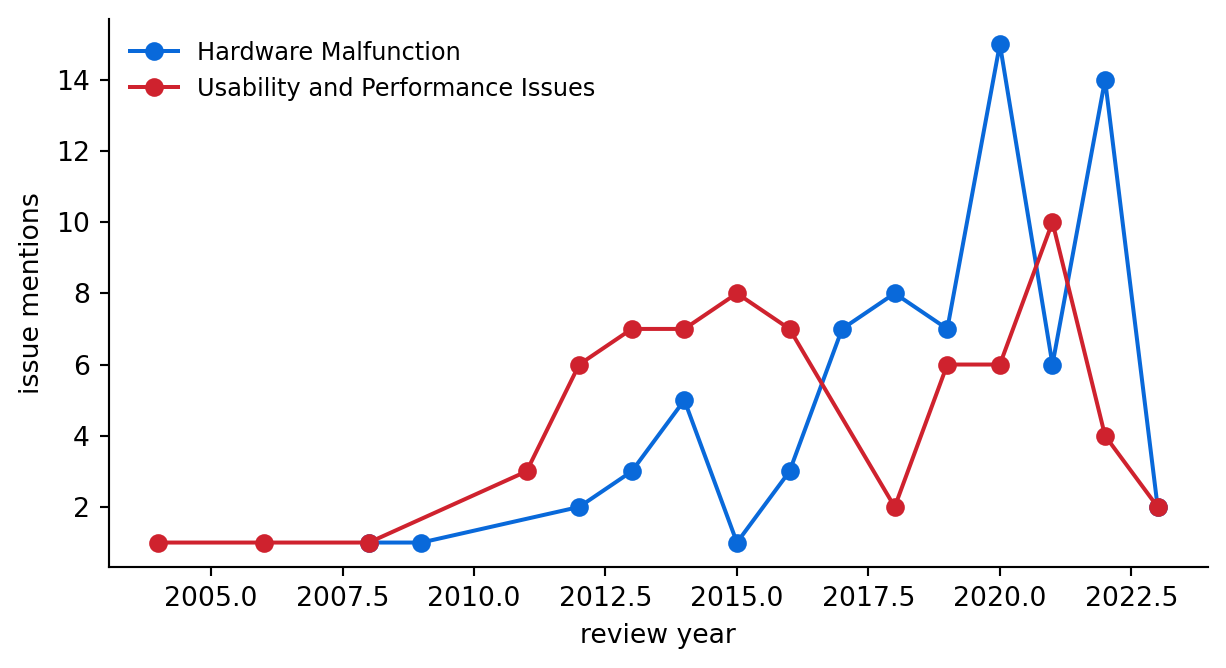
Milestone 3's move is the trend that turns counts into a story:
```{python}
#| label: fig-theme-trend
#| fig-cap: "The two largest themes in the miniature, tracked by review year. At one hundred fifty reviews the lines are suggestive; at fifty thousand, movements like these are the finding the brief is built on."
#| fig-alt: "Line chart of issue mentions per year for the two largest extracted themes, showing their relative size and movement over time."
import matplotlib.pyplot as plt

fig, ax = plt.subplots(figsize=(6.5, 3.6))
for t, color in zip(themes.theme_id.head(2), ["#0969da", "#cf222e"]):
    series = (issues[issues.theme_id == t].groupby("year").size().sort_index())
    label = themes.loc[themes.theme_id == t, "theme"].iloc[0]
    ax.plot(series.index, series.values, marker="o", color=color, label=label)
ax.set_xlabel("review year"); ax.set_ylabel("issue mentions")
ax.legend(frameon=False, fontsize=9)
ax.spines[["top", "right"]].set_visible(False)
plt.tight_layout(); plt.show()
```
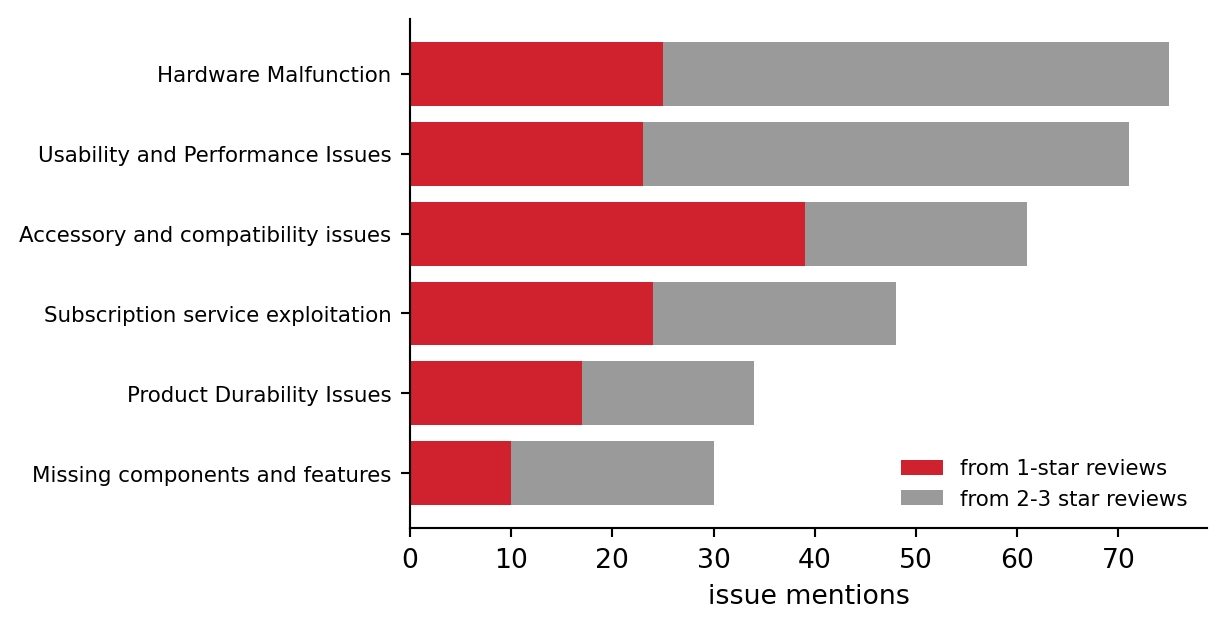
A trend says where a theme is going; the rating split says how much it costs. Here the same issues table is cut by the rating of the review each mention came from:
```{python}
#| label: fig-theme-rating-split
#| fig-cap: "Each theme's issue mentions split by the rating of the review they came from. Mentions concentrated in 1-star reviews are the dealbreaker signal, complaints from buyers the product already lost, while 2-3 star mentions come from customers the product has not yet lost."
#| fig-alt: "Horizontal stacked bar chart of the six miniature themes, largest at the top. Each bar splits the theme's issue mentions into a red segment for mentions from 1-star reviews and a gray segment for mentions from 2-3 star reviews."
seg = (issues.assign(seg=issues.rating.map(lambda r: "1 star" if r == 1 else "2-3 stars"))
       .groupby(["theme_id", "seg"]).size().unstack(fill_value=0)
       .reindex(themes.theme_id, fill_value=0))
one_star = seg.get("1 star", pd.Series(0, index=seg.index))
mid_star = seg.get("2-3 stars", pd.Series(0, index=seg.index))

fig, ax = plt.subplots(figsize=(6.5, 3.4))
ypos = range(len(seg))
ax.barh(ypos, one_star, color="#cf222e", label="from 1-star reviews")
ax.barh(ypos, mid_star, left=one_star, color="#9a9a9a", label="from 2-3 star reviews")
ax.set_yticks(ypos, themes.theme.tolist(), fontsize=8)
ax.invert_yaxis()
ax.set_xlabel("issue mentions")
ax.legend(frameon=False, fontsize=8, loc="lower right")
ax.spines[["top", "right"]].set_visible(False)
plt.tight_layout(); plt.show()
```
Read the bars by their red share, since a bar's length shows only the mention count the theme table already lists, while the red share carries the new information. A theme dominated by 1-star mentions is a dealbreaker: it ends purchases, and fixing it defends revenue. A theme whose mentions skew toward 2 and 3 stars is an annoyance that customers tolerate, which makes it a different kind of opportunity. The miniature kept only ratings of 3 and below, so the sharpest contrast, complaints inside otherwise positive reviews, is invisible here; Milestone 3 runs this same cut across the full rating range, where it becomes the "what to build next" signal.
This is the entire mechanism: extract, verify, theme, trend, segment, and the brief follows from the tables. The miniature also prices the project. One hundred fifty extractions cost about two cents, so fifty thousand cost a few dollars, which is the kind of arithmetic Gate A expects you to show, because a guessed estimate does not clear the gate. What the miniature cannot do is exactly what the milestones and gates below exist for: at this scale the themes are rough, the trends are noise-prone, and the verification runs ten labels deep where the gates demand fifty, so the project consists of the scale together with the verification.
| Milestone | Skills from | Artifact | Gate |
|---|---|---|---|
| 1. Structured extraction | Ch. 3, 11 | Issue and positive tables, one row per extraction | A: extraction quality |
| 2. Themes | Ch. 6, 13 | Theme table with names, counts, quotes | B: cluster quality |
| 3. Trends and segments | Ch. 13 | Trend table and charts by quarter and rating | feeds C |
| 4. The brief | all of the above | One page for a product manager | C: faithfulness |
## The data
We use the Amazon Reviews 2023 dataset released by the McAuley Lab at the University of California, San Diego (UCSD), available on Hugging Face. It covers dozens of product categories with review text, star rating, timestamp, and product identifiers. Pick one category that interests you and take tens of thousands of reviews from it; 50,000 is a good target, large enough that manual reading is hopeless and trends are visible, small enough to process for a few dollars.
```python
import json
from huggingface_hub import HfFileSystem

# Stream one category file; never hold the full category in memory or on disk.
fs = HfFileSystem()
path = ("datasets/McAuley-Lab/Amazon-Reviews-2023"
        "/raw/review_categories/Video_Games.jsonl")

with fs.open(path, "r") as f:
    for line in f:
        review = json.loads(line)
        # filter, checkpoint, and extract in batches as the milestones describe
```
Before any model sees this data, profile it the way Chapter 13 profiled the report corpus: the distribution of review lengths, the distribution of ratings, reviews per year. Two facts you find here will matter later. First, review length is heavy-tailed; a few reviews run thousands of words, and they will dominate your token bill if you let them. Second, ratings skew positive on Amazon (in most categories well over half are five stars, though you should confirm it in your own), which affects how you should read "share of reviews" numbers throughout.
## Milestone 1: structured extraction at scale
The first milestone applies Chapter 3 to every review: a schema-constrained call that turns free text into rows. Per review we want the overall sentiment, a list of issues (pain points), and a list of positives, where each issue carries a short verbatim-style description and a category from a fixed list.
```python
from pydantic import BaseModel
from typing import Literal

Category = Literal[
    "quality", "performance", "usability", "price",
    "shipping_packaging", "support", "compatibility", "other",
]

class Issue(BaseModel):
    description: str          # short phrase, in the customer's terms
    category: Category

class ReviewExtraction(BaseModel):
    sentiment: Literal["positive", "negative", "mixed"]
    issues: list[Issue]       # empty list if the review reports no problems
    positives: list[str]      # short phrases for what the customer praised
```
Fix the category list before you start and keep it short. Categories exist for segmentation in Milestone 3; the fine-grained structure comes from clustering the descriptions, which makes a long enum unnecessary. The prompt matters as much as the schema, and two instructions matter most: extract only what is stated, and treat empty lists as a correct answer. Without the second, models invent a problem to fill the field.
::: {.callout-tip title="With an AI coding tool"}
The `ReviewExtraction` and `Issue` models are exactly the kind of schema an assistant drafts well from a short description of what a review-mining pipeline needs. Hand it the category list and the empty-list requirement and ask for the Pydantic classes and the `extract_review` call, then read the result against Milestone 1's real failure mode: does the schema make an empty `issues` list the easy path, and does `Category` stay a short, fixed enum. A common defect in a drafted schema treats the empty list as a special case and grows `Category` into a long taxonomy whose structure belongs to Milestone 2's clustering. Getting that boundary right in the schema saves you from re-labeling tens of thousands of reviews later.
:::
```python
EXTRACTION_PROMPT = """You extract structured facts from a product review.
Report only what the reviewer actually states. Do not infer or speculate.
issues: problems the reviewer experienced, as short phrases in their terms.
positives: things the reviewer explicitly praised, as short phrases.
Empty lists are correct and common. A five-star review often has no issues;
a one-star review often has no positives."""

async def extract_review(text: str) -> ReviewExtraction:
    response = await client.beta.chat.completions.parse(
        model="meta-llama/llama-3.1-8b-instruct",  # cheap model, simple task
        messages=[{"role": "system", "content": EXTRACTION_PROMPT},
                  {"role": "user", "content": text}],
        response_format=ReviewExtraction,
    )
    return response.choices[0].message.parsed
```
**Estimate the cost before you run anything.** This is the habit Chapter 11 drilled, and at this scale it is not optional. A truncated review plus the prompt is about 200 input tokens, and the extraction is about 150 output tokens. At the cheap-model prices we have used throughout the book, $0.10 per million input tokens and $0.40 per million output tokens, the arithmetic is:
| Item | Tokens | Price per 1M | Cost |
|---|---|---|---|
| Input: 50,000 reviews × 200 | 10.0M | $0.10 | $1.00 |
| Output: 50,000 reviews × 150 | 7.5M | $0.40 | $3.00 |
| **Total** | | | **$4.00** |
::: {.callout-tip title="Cost: about four dollars, or two with the batch API"}
Roughly $4 for the full extraction pass at synchronous prices, and about $2 if your provider's batch API (application programming interface) is available. Batch jobs typically run at half price in exchange for results that arrive within a day, whereas synchronous calls return within seconds. The number that wrecks this estimate is review length, since an untruncated 3,000-word review costs twenty times the average. Truncate first (see the traps section), and run a 100-review pilot to confirm your per-review token averages before committing to the full pass.
On self-hosted hardware the same numbers read as throughput. Truncation cuts the tokens each review occupies the machine for, and the heavy tail of review lengths will cost you wall-clock time and capacity exactly as it will cost you dollars here.
:::
Run the extraction with the parallel pattern from Chapter 11, checkpointing as you go: write each completed batch to a JSONL file keyed by `review_id`, and on startup skip every id already on disk. A 50,000-call job will hit rate limits, transient errors, and at least one interruption; a pipeline that can resume loses nothing, while one that cannot starts over and doubles its bill.
```python
import asyncio, json
from pathlib import Path

CHECKPOINT = Path("extractions.jsonl")
done = {json.loads(line)["review_id"]
        for line in CHECKPOINT.open()} if CHECKPOINT.exists() else set()

async def extract_all(reviews, concurrency=20):
    sem = asyncio.Semaphore(concurrency)
    async def one(review):
        async with sem:
            result = await extract_review(review["text"][:2000])  # truncate!
            return review["review_id"], result
    pending = [r for r in reviews if r["review_id"] not in done]
    with CHECKPOINT.open("a") as f:
        for coro in asyncio.as_completed([one(r) for r in pending]):
            review_id, result = await coro
            f.write(json.dumps({"review_id": review_id,
                                **result.model_dump()}) + "\n")
```
The output of this milestone is a flat table: one row per extracted issue (and a parallel one for positives), joined back to the review's rating, timestamp, and id. Expect something on the order of 30,000 to 60,000 issue rows from 50,000 reviews. Do not proceed to Milestone 2 until this table passes Gate A below.
## Milestone 2: from extractions to themes
Sixty thousand issue strings are still too many to read. But they are short, self-contained phrases, ideal material for the embedding analytics of Chapter 13. Embed every issue description, cluster the vectors, and you have candidate themes: groups of issues that customers describe in different words but that mean the same thing.
```python
from gaba.embed import embed_texts
from sklearn.cluster import KMeans

X = embed_texts(issue_df["description"].tolist())

# Start around k=30 for a 50k-review category; tune by inspection.
kmeans = KMeans(n_clusters=30, random_state=0, n_init=10).fit(X)
issue_df["cluster"] = kmeans.labels_
```
Then name each cluster as Chapter 13 did: sample member descriptions, hand them to the model, and ask for a short theme label plus a one-sentence summary.
```python
def name_cluster(members: list[str], n_sample: int = 20) -> str:
    sample = random.sample(members, min(n_sample, len(members)))
    prompt = ("These phrases are customer complaints that clustered together.\n"
              "Give a 3-to-5-word theme name and a one-sentence summary.\n\n"
              + "\n".join(f"- {m}" for m in sample))
    return chat(prompt)   # the plain completion helper from Chapter 2
```
And apply the same check that chapter insisted on: a tidy label can conceal an incoherent cluster, so for every theme you intend to report, read 20 actual member strings yourself. If a third of them do not belong under the label, the theme is not real yet; split it (raise k, or recluster that cluster alone) or merge it with its neighbor. Expect a junk cluster or two, vague gripes like "bad product, do not buy" that carry sentiment but no theme; label them as junk and exclude them from the brief, because forcing a story onto them would manufacture a finding.
Your output here is a theme table: theme id, name, one-sentence summary, member count, and three representative quotes pulled from the source reviews. Quote the full review sentences, because the brief will quote customers, and an extracted phrase is your pipeline's paraphrase of them.
## Milestone 3: trends and segments
A theme's size says what hurts; its trajectory says what to do about it. Join the theme assignments back to review timestamps and ratings, then compute two views.
First, theme volume over time: for each theme, the share of that period's reviews that mention it, by quarter or by year. Use shares, because review volume itself grows and shrinks, so raw counts confound a theme's movement with that of the volume. A rising share means a worsening problem or a new one (a firmware update broke something, a design change backfired); a falling share means a problem being fixed or a product generation aging out. Either way the trajectory is what makes a theme actionable.
Second, theme by rating segment: what share of each theme's mentions come from 1-2 star reviews versus 4-5 star reviews. A theme concentrated in 1-star reviews is a dealbreaker that costs sales. A theme that appears in 4-star reviews is more interesting than it looks: these are customers who liked the product and complained anyway, which is where the "what to build next" signal comes from. The dealbreakers tell the team what to fix; the 4-star complaints tell them what to add. The miniature's @fig-theme-rating-split is this view in its cheapest form, 1 star against 2-3 within an already-negative sample; at full scale you keep every rating, and the 4-star column it could not show becomes the most valuable one.
```python
issue_df["quarter"] = pd.to_datetime(
    issue_df["timestamp"], unit="ms").dt.to_period("Q")

trend = (issue_df.groupby(["quarter", "theme"]).review_id.nunique()
         / issue_df.groupby("quarter").review_id.nunique()).unstack()
```
Plot the top eight themes as small multiples, since one spaghetti chart of eight lines is unreadable, and keep the matplotlib conventions from the rest of the book. Anything that will appear as a number in the brief should come from this table, computed once, in code you keep.
## Milestone 4: the brief
Now compress everything into one page, written for a product manager who has not seen your pipeline and never will. The structure we recommend:
1. **Headline finding.** One sentence: the single largest actionable opportunity and its size.
2. **Top pain themes.** Three to five themes, each with: name, share of reviews affected, trajectory (rising, flat, falling, with numbers), one verbatim customer quote, and the rating segment it concentrates in.
3. **The opportunity.** One recommendation: what to build, fix, or position against, and which theme evidence supports it.
4. **Method and confidence.** Three sentences on how the numbers were produced and the extraction precision you measured in Gate A, so the reader can calibrate trust.
The governing rule is that every claim traces to counted extractions and quoted reviews. "Customers love the build quality" is allowed only if the positives table shows it and a quote backs it. No number appears in the brief that you cannot recompute from your tables with a few lines of pandas. You may use the model to polish the prose of the brief; you may not use it to generate the findings.
::: {.callout-warning title="Don't outsource this"}
The judgment step, deciding which themes constitute an opportunity, belongs to you. A large language model (LLM) asked "what should the team build?" will produce a confident, generic answer for any input, and it cannot weigh what the data does not contain: the cost of a fix, the competitive landscape, what the team can actually build. The pipeline's job is to put verified counts and real quotes in front of you. Choosing among them, deciding that the rising 4-star complaint about storage capacity matters more than the larger but falling complaint about packaging, is the analyst's contribution, and it is the part a hiring manager or an instructor reads your brief to see.
:::
## Evaluation gates
The pipeline has three stages, and a defect at any stage flows silently into the brief. So we gate each stage, in the spirit of Chapter 9: a small labeled sample, a measurement, and a threshold you must clear before the next milestone's outputs can be trusted.
**Gate A: extraction quality.** Before scaling past the pilot, hand-label 50 randomly sampled reviews yourself: read each one and write down the issues a careful human would extract, before you look at what the model produced, so the model's answer cannot anchor yours. Then compare and count three things per review, matching issues by meaning, because exact wording rarely lines up:
```python
# Per review in the golden set of 50:
#   true_positives:  model issues that match one of your labeled issues
#   false_positives: model issues with no support in the review
#   false_negatives: labeled issues the model missed
precision = tp / (tp + fp)   # what share of extracted issues are real
recall    = tp / (tp + fn)   # what share of real issues were extracted
```
Also check the empty case: of your sampled reviews with no genuine complaint, how often did the model invent one? What good looks like: precision at or above 0.85, recall at or above 0.75, and invented issues in under 1 of 10 no-complaint reviews. Below that, fix the prompt and schema and re-measure on the same golden set; do not scale a leaky extractor, because at 50,000 reviews a 25% false-positive rate is more than ten thousand phantom complaints flowing into your themes. This is the golden-set discipline of Chapter 9 in its smallest useful form, and the 50 labels you write here are reusable for every prompt revision afterward.
**Gate B: cluster quality.** For each theme you plan to report, conduct an intruder test, the same logic as Chapter 9's human checks: take 5 member descriptions from the cluster, plant 1 description drawn from a different cluster, shuffle, and see whether you (or better, a classmate who did not construct the clusters) can identify the intruder. A coherent cluster makes the intruder obvious; an incoherent one makes it a coin flip. What good looks like: the intruder identified in at least 4 of 5 trials per reported theme. Themes that fail get split, merged, or dropped, and their failure is itself information about where the embedding space separates poorly.
Building a lineup needs no model calls at all, so the test costs nothing but attention. Here it is on the miniature's own clusters, once on the tightest cluster by member-to-centroid similarity and once on the loosest:
```{python}
import numpy as np

def coherence(t: int) -> float:
    """Mean cosine similarity of a cluster's members to its centroid."""
    m = vecs[(issues.theme_id == t).to_numpy()]
    c = m.mean(axis=0)
    return float((m @ (c / np.linalg.norm(c))).mean())

coh = {int(t): coherence(t) for t in themes.theme_id}
tightest, loosest = max(coh, key=coh.get), min(coh, key=coh.get)

def intruder_trial(t: int, seed: int) -> None:
    rng = np.random.default_rng(seed)
    members = issues.loc[issues.theme_id == t, "issue"].drop_duplicates().tolist()
    others = issues.loc[issues.theme_id != t, "issue"].drop_duplicates().tolist()
    lineup = list(rng.choice(members, size=min(5, len(members)), replace=False))
    lineup.append(others[int(rng.integers(len(others)))])   # the intruder, last
    order = rng.permutation(len(lineup))
    name = themes.loc[themes.theme_id == t, "theme"].iloc[0]
    print(f"theme '{name}' (coherence {coh[t]:.2f}): spot the intruder")
    for i, j in enumerate(order):
        print(f"  {i + 1}. {lineup[j]}")
    print(f"  -> the intruder is #{list(order).index(len(lineup) - 1) + 1}\n")

intruder_trial(tightest, seed=0)
intruder_trial(loosest, seed=1)
```
Cover the answer lines and try both lineups before reading on. On the tight cluster the intruder should jump out, and that felt obviousness is what a reportable theme feels like. On the loose cluster the choice is often genuinely ambiguous, and the ambiguity is the measurement: if the cluster's own members do not cohere enough to expose an outsider, the theme's label is a caption on a pile and cannot be reported as a finding. Once you have made your call, run the real gate with a judge who did not build the clusters, since the builder always knows too much.
**Gate C: brief faithfulness.** Hand your finished brief and extraction tables to someone else (or yourself a day later, working only from the tables). For every number and every quote in the brief: can it be recomputed or located in the data? What good looks like: 100%. This gate has no partial credit, for the same reason that in Chapter 9 we gave faithfulness special status: a brief that is 95% faithful is not 95% trustworthy, because the reader cannot tell which 5% to discount.
## Traps
Five failure modes recur in this project. We name them here so that you can watch for them before they surface in your grade.
**Agreement bias inflates positives.** Models are reluctant to report that a review contains nothing nice, so the positives list fills with weak inferences like "the customer implies the price was acceptable". Instruct the model that empty lists are valid, and extract only what is stated. Check the rate of empty positives in your Gate A sample against your own labels.
**Paraphrase clusters that look like themes.** A cluster whose members are 800 near-identical strings ("stopped working after a month," "quit working in a month") is one complaint repeated, and reporting it as a discovered structure overstates the finding; when the shared phrasing originates in your extraction prompt, moreover, the cluster is an artifact of the pipeline, because the customers never wrote those words. Quote the underlying reviews, whose wording the pipeline could not have planted, and be suspicious of any cluster with very low internal variety.
**Survivor bias.** Reviews come from people who bought the product and bothered to write; people who abandoned the purchase, returned it silently, or churned before owning it are invisible. Your brief describes the experience of buyers who speak, and the method section should say so, because a claim about "customers" at large would overreach the sample.
**Cost blowups from unbounded review length.** The heavy tail of review lengths can multiply your token bill several-fold. Truncate every review to a fixed budget (2,000 characters captures the substance of nearly all reviews) before it enters the prompt. Assert the truncation in code, since the data cannot be trusted to stay short.
**Non-English reviews.** Most categories contain a slice of reviews in other languages. The extractor may translate them, mangle them, or refuse them, each behavior corrupting a different downstream stage. Decide a policy up front, where the simple one is to detect and exclude non-English text, and report the excluded share in your method note.
## Going further
Three natural extensions, each connecting to a chapter you have already read. First, temporal drift: Chapter 24's monitoring mindset applies directly here; productionize the trend analysis so each new quarter of reviews is extracted, assigned to existing themes, and flagged when a theme's share shifts beyond its historical range, turning a one-off study into an early-warning system. Second, a RAG (retrieval-augmented generation) assistant over the reviews: with reviews chunked and embedded, the Chapter 7 pipeline gives the product team an interface to ask "what do customers say about the battery?" and get quoted, cited answers, with your theme table doubling as a retrieval filter. Third, a dashboard: the theme, trend, and segment tables are exactly the structure a Plotly Dash or Streamlit app takes as input, and a brief that updates itself stays useful longer than one frozen in a slide deck.
## Project rubric
| Component | What is assessed | Points |
|---|---|---|
| Gate A: extraction quality | A hand-labeled 50-review sample; reported precision and recall; documented prompt iterations; thresholds met or the shortfall analyzed | 25 |
| Gate B: cluster quality | Intruder tests on every reported theme; incoherent clusters split, merged, or dropped, with the decisions explained | 20 |
| Gate C: brief faithfulness | Recomputable numbers, locatable quotes, and a method-and-confidence section | 25 |
| Brief quality | One page; themes sized and trended with evidence; a specific, defensible opportunity recommendation; readable by someone who never saw the pipeline | 30 |
| **Total** | | **100** |
A brief that reads beautifully but fails Gate C scores lower than a plain one whose every number checks out. This weighting is deliberate, because in this field the analysis you can verify is the only analysis you have.